
Independent · No ads · No commission
How much does dental work cost?
Observed negotiated prices for 41 dental treatments across 52 states and 807 cities, taken from 1 payer file published under the federal Transparency in Coverage rule. Every figure shows its sample size. Nothing here is modelled from a national average.




How much common dental work costs
Median negotiated prices across the US, from dental implant and crown costs to the price of a cleaning, filling or extraction. Click any treatment for prices in your state and city.
- Dental implant cost$1,500typically $1,333–$1,710
- Dental crown cost$839typically $710–$933
- Molar root canal cost$786typically $684–$897
- Teeth cleaning cost$68typically $58–$76
- Tooth Filling cost$118typically $100–$137
- Tooth extraction cost$110typically $90–$130
- Impacted wisdom tooth removal cost$327typically $286–$374
- Adult braces cost$4,350typically $3,823–$4,939
- Upper denture cost$974typically $818–$1,130
- Porcelain veneer cost$750typically $636–$869
- Dental bridge cost$736typically $640–$828
- Deep teeth cleaning cost$173typically $144–$199
Average cost of dental procedures
The range is the middle half of the market — the 25th to 75th percentile of what plans actually pay. A wide spread means the price you are quoted depends heavily on which practice you walk into.
Observed negotiated price ranges for six common treatments
Ranked by median price
Median of the observed distribution. The full range for each treatment is in the table below.
Every treatment, with its full range
| Treatment | Negotiated range Observed | Median | Spread | Practices (n) | Est. self-pay Estimated |
|---|---|---|---|---|---|
| Full braces, adult | $3,823 – $4,939 | $4,350 | 19,400 | $4,350 – $5,600 | |
| Full braces, teenager | $3,722 – $4,736 | $4,200 | 18,905 | $4,200 – $5,485 | |
| Implant post placed in the jaw | $1,333 – $1,710 | $1,500 | 24,583 | $1,500 – $1,978 | |
| Partial upper denture with metal frame | $912 – $1,212 | $1,066 | 24,764 | $1,066 – $1,369 | |
| Partial lower denture with metal frame | $914 – $1,208 | $1,063 | 24,774 | $1,063 – $1,366 | |
| Ceramic crown attached to an implant | $871 – $1,160 | $1,013 | 23,647 | $1,013 – $1,366 | |
| Full upper denture | $818 – $1,130 | $974 | 24,901 | $974 – $1,296 | |
| Full lower denture | $804 – $1,119 | $972 | 24,826 | $972 – $1,280 | |
| Ceramic crown on an implant abutment | $842 – $1,106 | $962 | 23,810 | $962 – $1,264 | |
| All-ceramic crown | $710 – $933 | $839 | 24,987 | $839 – $1,023 | |
| Porcelain-and-metal crown | $674 – $879 | $788 | 25,129 | $788 – $964 | |
| Root canal, molar | $684 – $897 | $786 | 25,495 | $786 – $996 | |
| Gum surgery (per quadrant) | $684 – $908 | $780 | 25,581 | $780 – $1,042 | |
| Porcelain veneer (per tooth) | $636 – $869 | $750 | 23,813 | $750 – $984 | |
| Bridge, porcelain-and-metal span unit | $640 – $828 | $736 | 25,347 | $736 – $916 | |
| Root canal, premolar | $542 – $715 | $628 | 25,490 | $628 – $798 | |
| Root canal, front tooth | $461 – $617 | $538 | 25,305 | $538 – $690 | |
| Hard night guard for grinding | $285 – $382 | $336 | 22,543 | $336 – $416 | |
| Fully-impacted wisdom tooth removal | $286 – $374 | $327 | 25,234 | $327 – $424 | |
| Bone graft at an implant site | $254 – $417 | $317 | 21,933 | $317 – $477 | |
| Partly-impacted wisdom tooth removal | $242 – $323 | $281 | 25,595 | $281 – $364 | |
| Surgical tooth extraction | $158 – $221 | $190 | 25,389 | $190 – $252 | |
| Core build-up under a crown | $142 – $200 | $173 | 25,517 | $173 – $225 | |
| Deep cleaning, four or more teeth per quadrant | $144 – $199 | $173 | 25,278 | $173 – $224 | |
| White filling, back tooth, two surfaces | $130 – $176 | $153 | 25,042 | $153 – $200 | |
| White filling, back tooth | $100 – $137 | $118 | 24,954 | $118 – $156 | |
| Silver filling, two surfaces | $95 – $129 | $110 | 25,241 | $110 – $148 | |
| Simple tooth extraction | $90 – $130 | $110 | 25,410 | $110 – $149 | |
| Deep cleaning, one to three teeth per quadrant | $88 – $131 | $108 | 25,788 | $108 – $154 | |
| White filling, front tooth | $91 – $124 | $107 | 25,214 | $107 – $139 | |
| Ongoing gum maintenance cleaning | $82 – $111 | $96 | 25,251 | $96 – $126 | |
| Full-mouth X-ray series | $84 – $106 | $95 | 23,996 | $95 – $118 | |
| Silver filling, one surface | $77 – $104 | $89 | 24,980 | $89 – $118 | |
| Emergency visit for dental pain | $58 – $84 | $69 | 25,084 | $69 – $99 | |
| Adult teeth cleaning | $58 – $76 | $68 | 24,084 | $68 – $84 | |
| Comprehensive exam (new patient) | $48 – $66 | $58 | 24,548 | $58 – $75 | |
| Child teeth cleaning | $44 – $56 | $50 | 24,553 | $50 – $61 | |
| Four bitewing X-rays | $39 – $50 | $45 | 24,130 | $45 – $55 | |
| Routine check-up (returning patient) | $31 – $41 | $36 | 23,692 | $36 – $46 | |
| Dental sealant (per tooth) | $33 – $42 | $36 | 25,244 | $36 – $46 | |
| Fluoride varnish treatment | $26 – $34 | $29 | 23,556 | $29 – $39 |
Most-searched dental procedure prices
Each page shows the national distribution, a state-by-state breakdown and what the fee does and does not include.
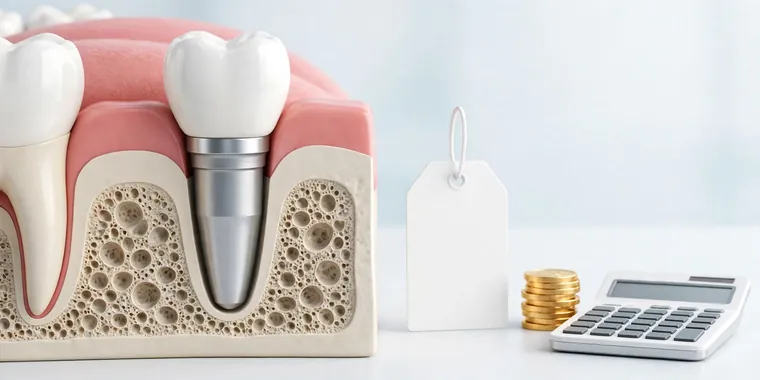 Dental implant costMedian $1,500 · 24,583 practices
 Dental crown costMedian $839 · 24,987 practices
 Adult braces costMedian $4,350 · 19,400 practices
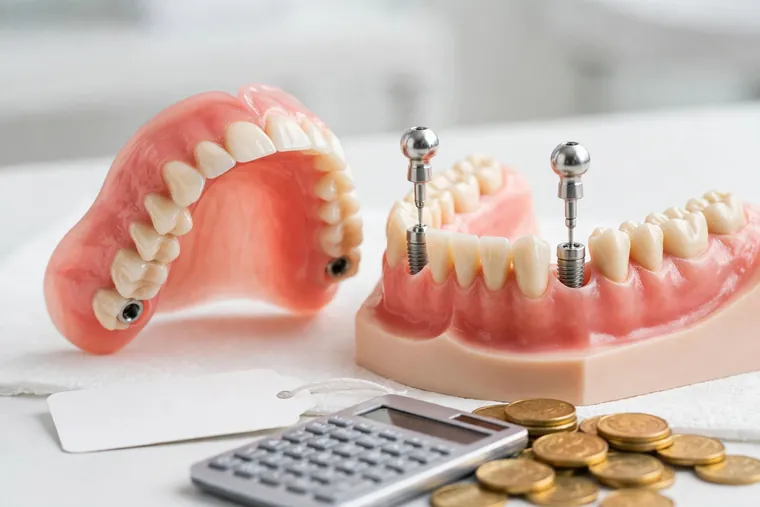 Upper denture costMedian $974 · 24,901 practices
 Porcelain veneer costMedian $750 · 23,813 practices
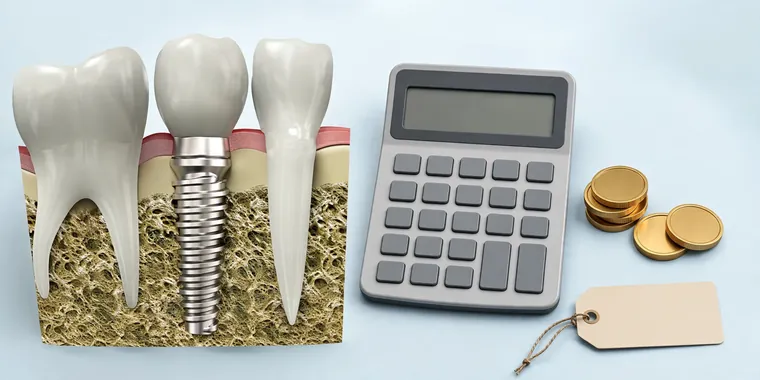 Dental bridge costMedian $736 · 25,347 practices
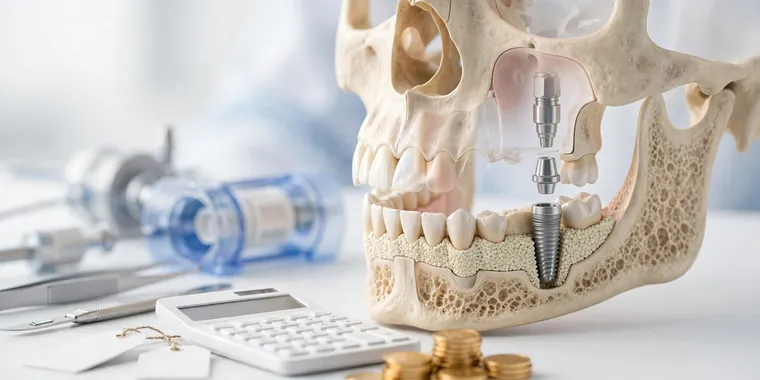 Tooth extraction costMedian $110 · 25,410 practices
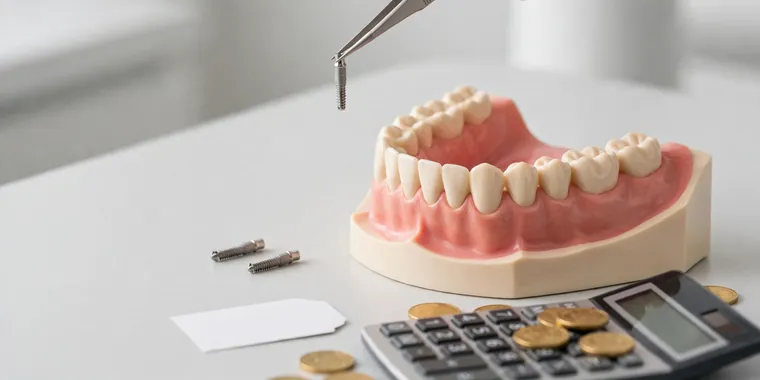 Molar root canal costMedian $786 · 25,495 practices
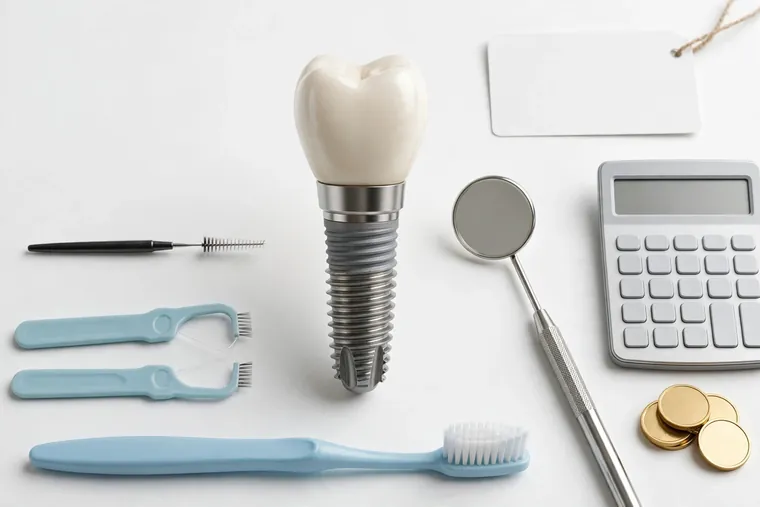 Teeth cleaning costMedian $68 · 24,084 practices
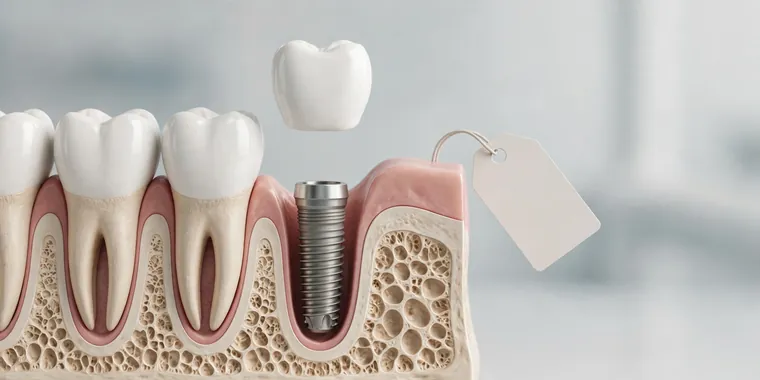 Implant crown costMedian $1,013 · 23,647 practices
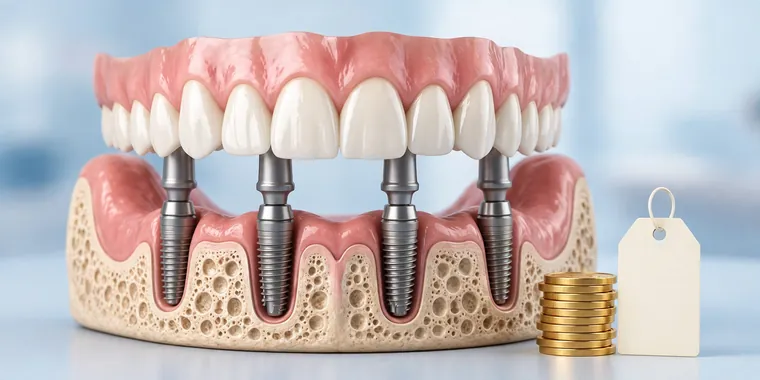 Implant abutment crown costMedian $962 · 23,810 practices
 Dental bone graft costMedian $317 · 21,933 practices
Dental costs by type of treatment
Eleven guides covering what each group of treatments involves, what moves the price, and what is usually billed separately.
Dental costs by state
Every state where our source files contain enough located practices to publish. Each page compares local prices against the national distribution and lists the cities below it.
| State | Treatments priced | Cities published | Largest sample |
|---|---|---|---|
| Alabama | 41 | 11 | 320 |
| Alaska | 41 | 1 | 47 |
| Arizona | 41 | 15 | 645 |
| Arkansas | 41 | 6 | 206 |
| California | 41 | 109 | 2,870 |
| Colorado | 41 | 17 | 614 |
| Connecticut | 41 | 14 | 377 |
| Delaware | 41 | 3 | 58 |
| District of Columbia | 41 | 1 | 145 |
| Florida | 41 | 62 | 1,749 |
| Georgia | 41 | 23 | 697 |
| Hawaii | 41 | 1 | 57 |
| Idaho | 41 | 5 | 152 |
| Illinois | 41 | 28 | 1,015 |
| Indiana | 41 | 15 | 461 |
| Iowa | 41 | 10 | 224 |
| Kansas | 41 | 10 | 255 |
| Kentucky | 41 | 7 | 460 |
| Louisiana | 41 | 12 | 343 |
| Maine | 41 | 1 | 60 |
| Maryland | 41 | 20 | 568 |
| Massachusetts | 41 | 25 | 773 |
| Michigan | 41 | 18 | 673 |
| Minnesota | 41 | 10 | 318 |
| Mississippi | 41 | 8 | 213 |
| Missouri | 41 | 16 | 490 |
| Montana | 41 | 1 | 61 |
| Nebraska | 41 | 4 | 187 |
| Nevada | 41 | 6 | 312 |
| New Hampshire | 41 | 0 | 66 |
| New Jersey | 41 | 34 | 1,022 |
| New Mexico | 41 | 4 | 161 |
| New York | 41 | 37 | 1,743 |
| North Carolina | 41 | 25 | 708 |
| North Dakota | 41 | 1 | 32 |
| Ohio | 41 | 24 | 902 |
| Oklahoma | 41 | 9 | 340 |
| Oregon | 41 | 9 | 274 |
| Pennsylvania | 41 | 33 | 1,339 |
| Puerto Rico | 41 | 0 | 34 |
| Rhode Island | 41 | 2 | 56 |
| South Carolina | 41 | 10 | 299 |
| South Dakota | 41 | 1 | 39 |
| Tennessee | 41 | 17 | 561 |
| Texas | 41 | 62 | 2,298 |
| Utah | 41 | 15 | 331 |
| Vermont | 41 | 0 | 18 |
| Virginia | 41 | 29 | 733 |
| Washington | 41 | 23 | 656 |
| West Virginia | 41 | 3 | 177 |
| Wisconsin | 41 | 9 | 357 |
| Wyoming | 41 | 1 | 38 |
Dental prices in major cities
The cities with the largest samples behind them. 807 cities are published in total — find the rest through the state pages.
How the numbers are built
What makes this different
Most dental cost sites publish a national average, multiply it by a state cost index, and present the result as a local price. It fills a page for every city, but it is an estimate wearing the clothes of an observation.
- 1,003,013 real observations, each one a practice, not a row.
- Sample size on every figure. If n is small, you can see it.
- 37,640 outliers dropped and reported — these files contain placeholder values, and we say how many we removed.
- Nothing published below threshold. We would rather have gaps than invent a local number.
- Negotiated and self-pay never mixed, and the self-pay figure is always labelled an estimate.
- No ads, no affiliate links, no sponsored placements.
Guides to paying for dental work
Knowing the price is half of it. These cover the part that decides your actual bill.
 How dental insurance actually worksAnnual maximums, waiting periods, UCR limits and downgrades explained, with real negotiated prices showing what a typical plan leaves you to pay.
 Paying for dental work without insuranceWhat uninsured patients actually pay, why it differs from negotiated rates, and the routes that genuinely reduce a dental bill.
 Financing a large dental billPayment plans, medical credit cards, HSA and FSA money and in-house financing compared, including what each really costs.
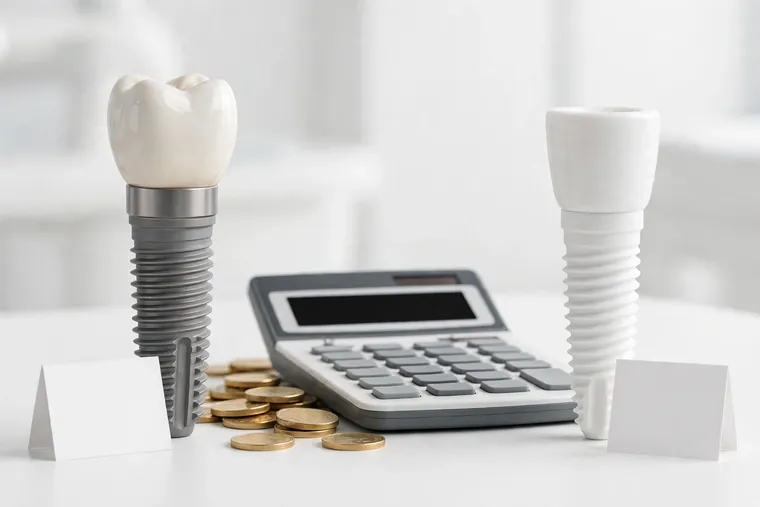 Dental savings plans versus insuranceA discount membership is not insurance.
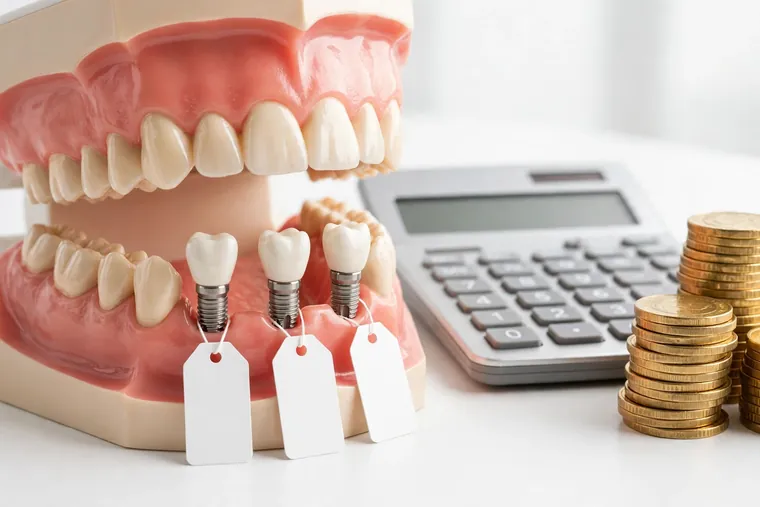 How to read a dental treatment planHow to check a quote line by line, which items are commonly missing, and the questions that change the total.
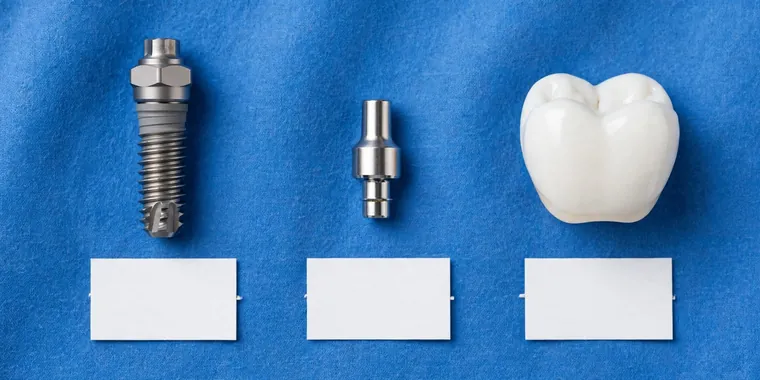 Why dental prices vary so muchWhy the same treatment costs double at the practice down the road, and what that means for how you shop.
Take the data
The whole dataset is downloadable as CSV or JSON under a Creative Commons Attribution licence — 28,665 published price cells, each with its sample size, plus the full provenance metadata. If you think a figure here is wrong, this is how you check it.
Common questions
Where does this price data come from?
Payer machine-readable files published under the federal Transparency in Coverage rule (45 CFR 147.212). We stream those files, keep the 41 treatment codes people search for, and attribute each rate to a practice location using public CMS registries. Every source file is listed on the sources page.
Is this what I will pay at the dentist?
Not directly. These are negotiated in-network rates — what a dental plan pays a contracted practice. If you are uninsured you will generally be quoted at or above the top of each range. We show an estimated self-pay range, labelled as an estimate everywhere, because we do not observe cash prices and will not model one and present it as data. See paying without insurance.
How much does a dental implant cost?
The implant post has a median negotiated price of $1,500 nationally, but that is the foundation only. The crown and any abutment or bone graft are separate procedures with separate fees, which is why advertised implant prices look so low. See the full breakdown on how to read a treatment plan.
How much does a crown cost?
An all-ceramic crown has a median negotiated price of $839, with the middle half of the market running $710 to $933. A build-up underneath is often billed separately.
How much does a root canal cost?
The median negotiated price is $786 nationally, with the middle half of practices at $684 to $897. That is for a molar; front teeth cost less, and the crown that usually follows is billed separately. See molar root canal cost by state.
How much does a teeth cleaning cost without insurance?
The median negotiated price is $68 nationally, with the middle half of practices at $58 to $76. Uninsured patients are usually quoted at or above the top of that range. See teeth cleaning cost by state.
How much does a tooth extraction cost?
The median negotiated price is $110 nationally, with the middle half of practices at $90 to $130. Surgical and wisdom tooth extractions cost more. See tooth extraction cost by state.
How much do braces cost?
The median negotiated price is $4,350 nationally, with the middle half of practices at $3,823 to $4,939. That is full comprehensive treatment for an adult. See adult braces cost by state.
How much do dentures cost?
The median negotiated price is $974 nationally, with the middle half of practices at $818 to $1,130. That is per arch, for a full upper denture. See upper denture cost by state.
Why do you show a range instead of one average?
Because an average hides the thing that matters. Two markets with the same mean behave completely differently if one is tightly clustered and the other is not. The gap between the cheaper and dearer end of your local market is what shopping around is worth, and we state it in dollars on every city page.
Why is my city or treatment missing?
Because too few practices there met our publication threshold — 8 distinct practices for a city figure, 15 for a state. Below that we publish nothing rather than scaling a national average to look local. Gaps here are real, not oversights.
Can I download the data?
Yes, all of it, free, under a Creative Commons Attribution licence — see open data. Every figure carries its sample size so you can check our arithmetic.
Do you sell anything or take commission?
No. There is no advertising, no affiliate link and no sponsored placement anywhere on this site. That matters on a topic where most cost guides earn commission on the financing and insurance products they recommend.
A limitation worth stating up front: these prices currently come from a single payer's network. Standalone dental plans are exempt from the disclosure rule, so dedicated dental carriers publish nothing at all. That is a real selection effect and it is documented in full on the methodology page.